We developed several proof of concept applications (busbar and magnet resistance as well as quench heater discharge analysis) and gathered functional specification for others. Introduction of Apache Airflow for scheduling to the signal monitoring workflow allows for completing the applications, their testing against historical data, and use for Run3 of the LHC.
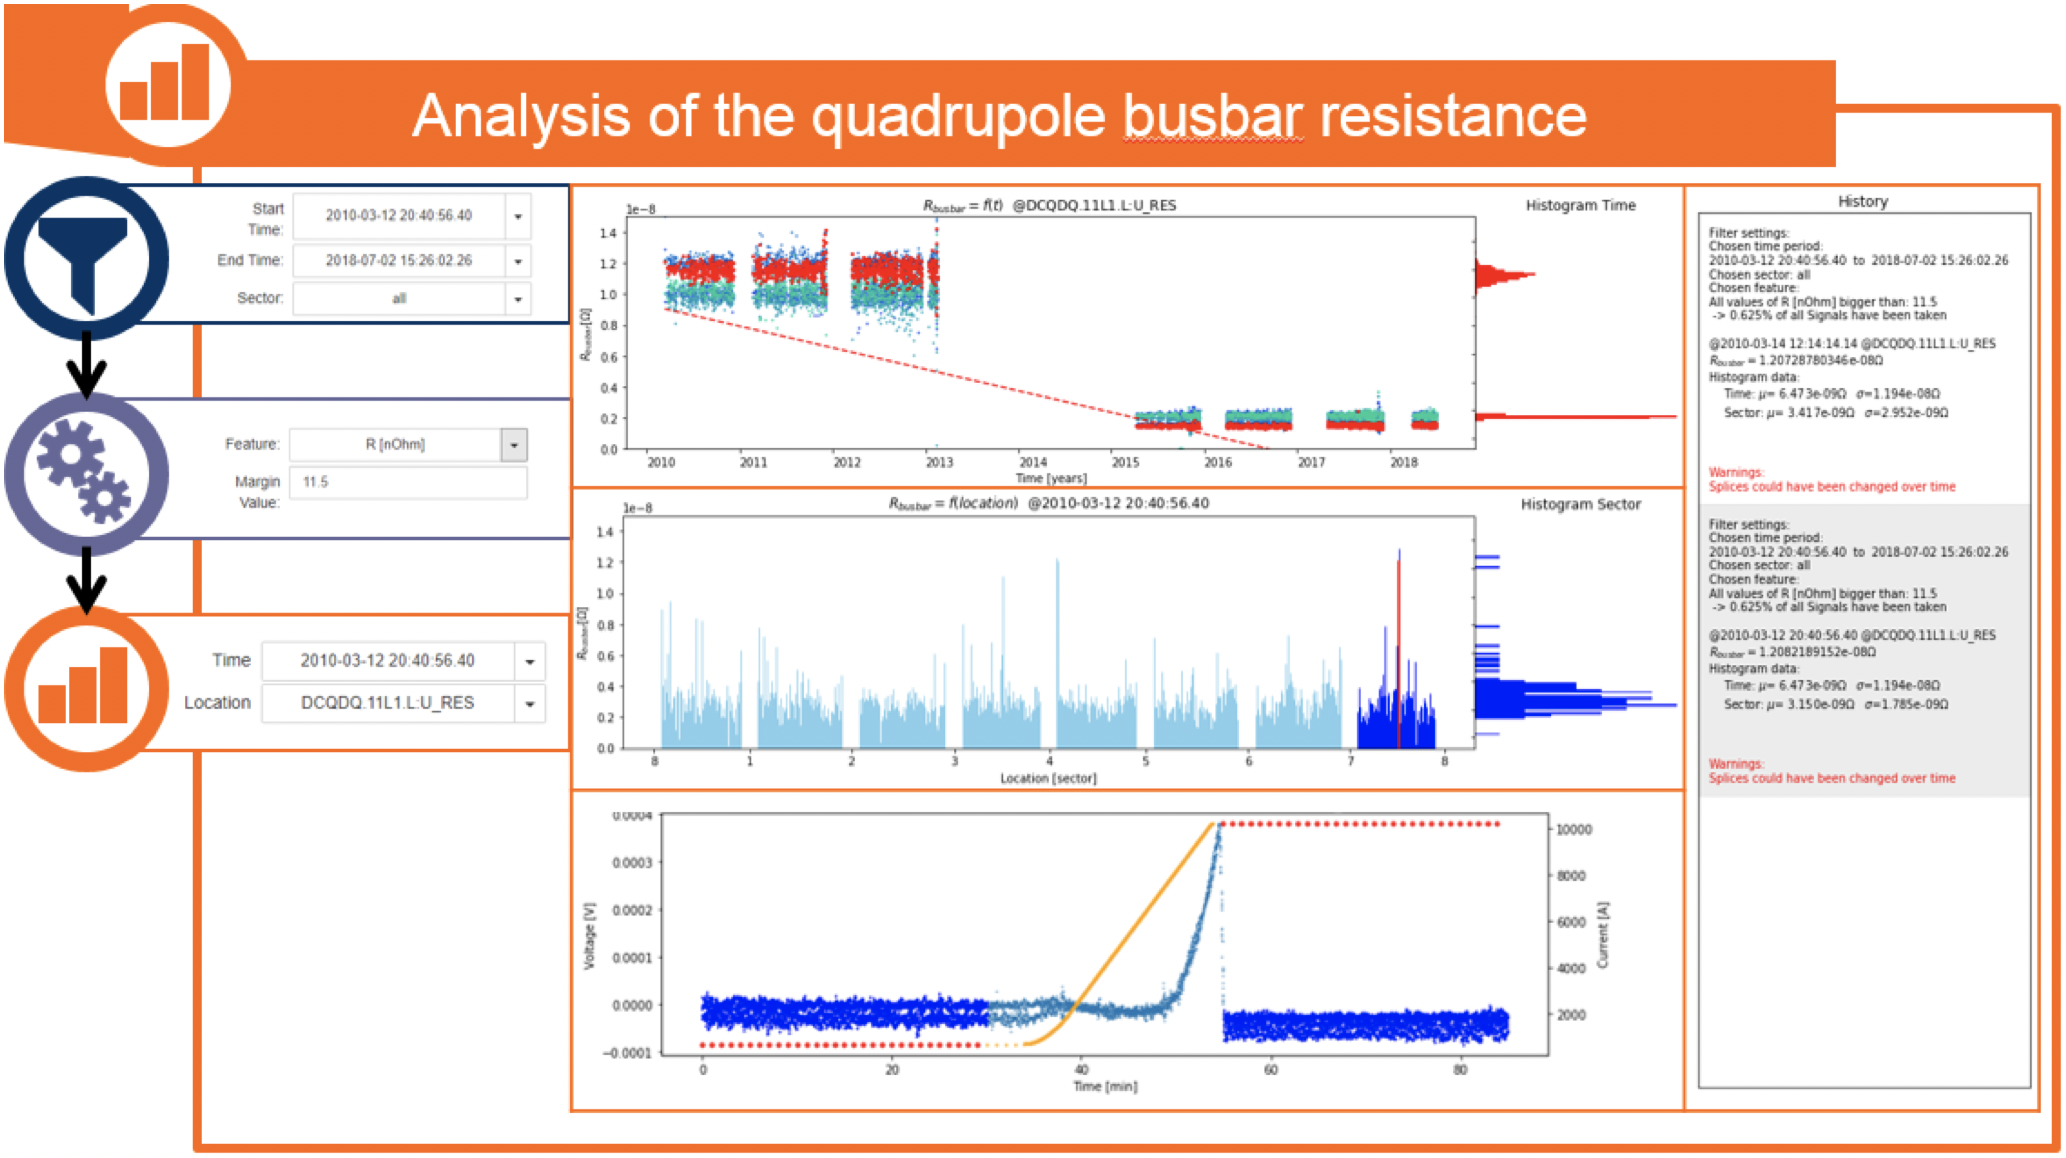
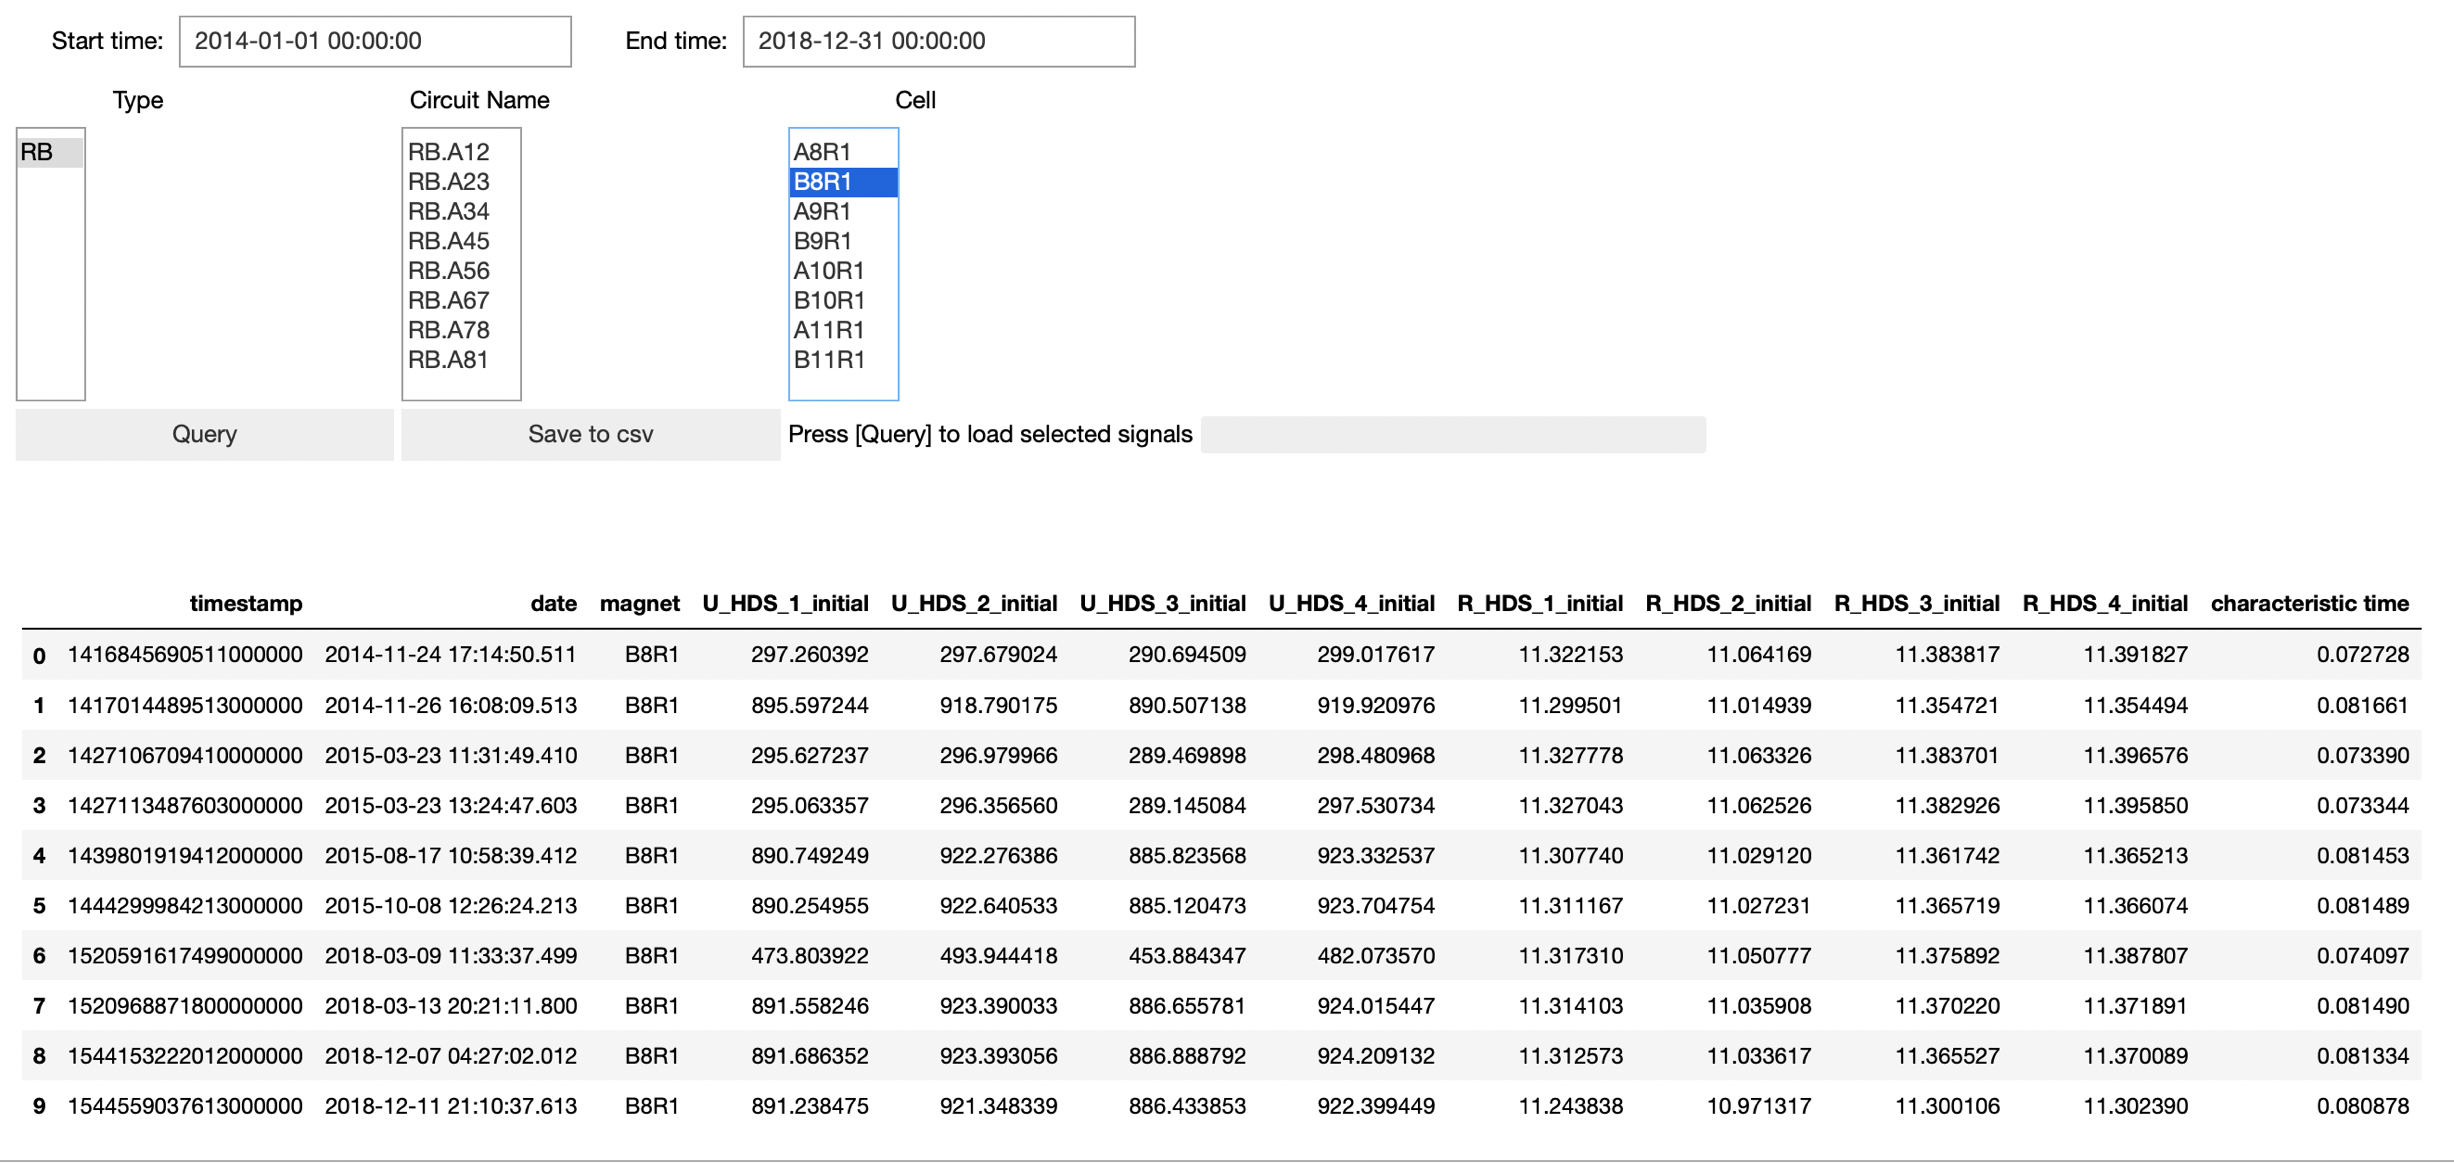
1. Busbar and Magnet Resistance
- Event: machine cycle from injection to stable beams;
- Feature: busbar and magnet resistance calculated as a linear fit from current plateaus, signal-to-noise ratio;
- Circuits: RB, RQ;
- Database: NXCALS (resistance calculated in parallel for all busbars); calculation verified against LabVIEW application;
- GUI: a dashboard for analysing and browsing historical data
2. Quench Heater Discharge
- Event: quench heater PM event;
- Feature: characteristic decay time (charge approach, energy approach, log/exp fit); initial resistance, voltage, and current (MB); comparison to reference discharge;
- Circuits: RB, RQ, IPQ, IPD, IT;
- Database: PM; calculation verified against LabVIEW application;
- GUI: a dashboard for analysing and browsing historical data.
3. QPS Individual System Test
QPS board have been monitored with an application continuously query the CALS database. The migration to NXCALS calls for a migration of the application. The application calculating busbar resistance provides a template for querying signal features at scale. We developed a proof-of-concept application that can replace the outdated one. The application is characterized by:
- Event: regular interval, machine cycles;
- Feature: mean, std, count of all signals;
- Circuits: All circuits with QPS;
- Database: NXCALS;
- GUI: no, only a warning in case a board is not operating properly;
4. Grounding Network Current and Voltage
Monitoring of earth current for all circuits, deviations from a historical trend could indicate a slowly developing deterioration of the ground insulation. The RB and RQ circuits have so-called voltage feelers installed, one per half cell, so 54 per circuit. During ramping (and FPA) these voltages should have a very regular pattern. During a plateau, these voltages basically show the variation of the ground voltage along the circuit (or along the tunnel), since the RB circuit is almost equipotential (except for the splice resistances, so about 154*10*0.3 nOhm*11000 A = 5 mV).
- Event: FPA, ramp when dI / dt = constant;
- Feature: mean, std, count of voltage to ground, earth current;
- Circuits: all circuits (earth current); RB, RQ (voltage feelers);
- Database: NXCALS, PM;
- GUI: to be developed;
5. Conical Joint Resistance
As of the Run3, the conical joint voltage of the RB circuit will be logged to the NXCALS database. That allows for monitoring its resistance during operation in a similar manner as it is the case for the busbars and magnets:
- Event: machine cycle from injection to stable beams;
- Feature: conical joint resistance calculated as a linear fit from current plateaus, signal-to-noise ratio;
- Circuits: RB;
- Database: NXCALS;
- GUI: no, potentially the busbar GUI can be reused;