Home
- Home
- Home
Signal Monitoring Project
A framework for unified logging database access (Post Mortem and NXCALS), signal processing, execution of analysis modules on the CERN computing cluster, storage and browsing of results.
- Home
- Home
Signal Monitoring Project
We develop a python library for database query and signal processing along with analysis notebooks for signal monitoring as well as hardware commissioning and operational analysis.

During Hardware Commissioning (HWC) campaigns all LHC Super Conducting (SC) circuits are tested and analysed by the MP3 team (http://cern.ch/mp3) in a very rigorous and detailed way. However, the period of operation in-between HWC campaigns is long, and due to continuous cycling of the magnets, some circuits might degrade during operation. Detecting precursors or indications of degraded behavior as early as possible is important to limit potential damage, advice operation team, and plan measures to fix the issues.
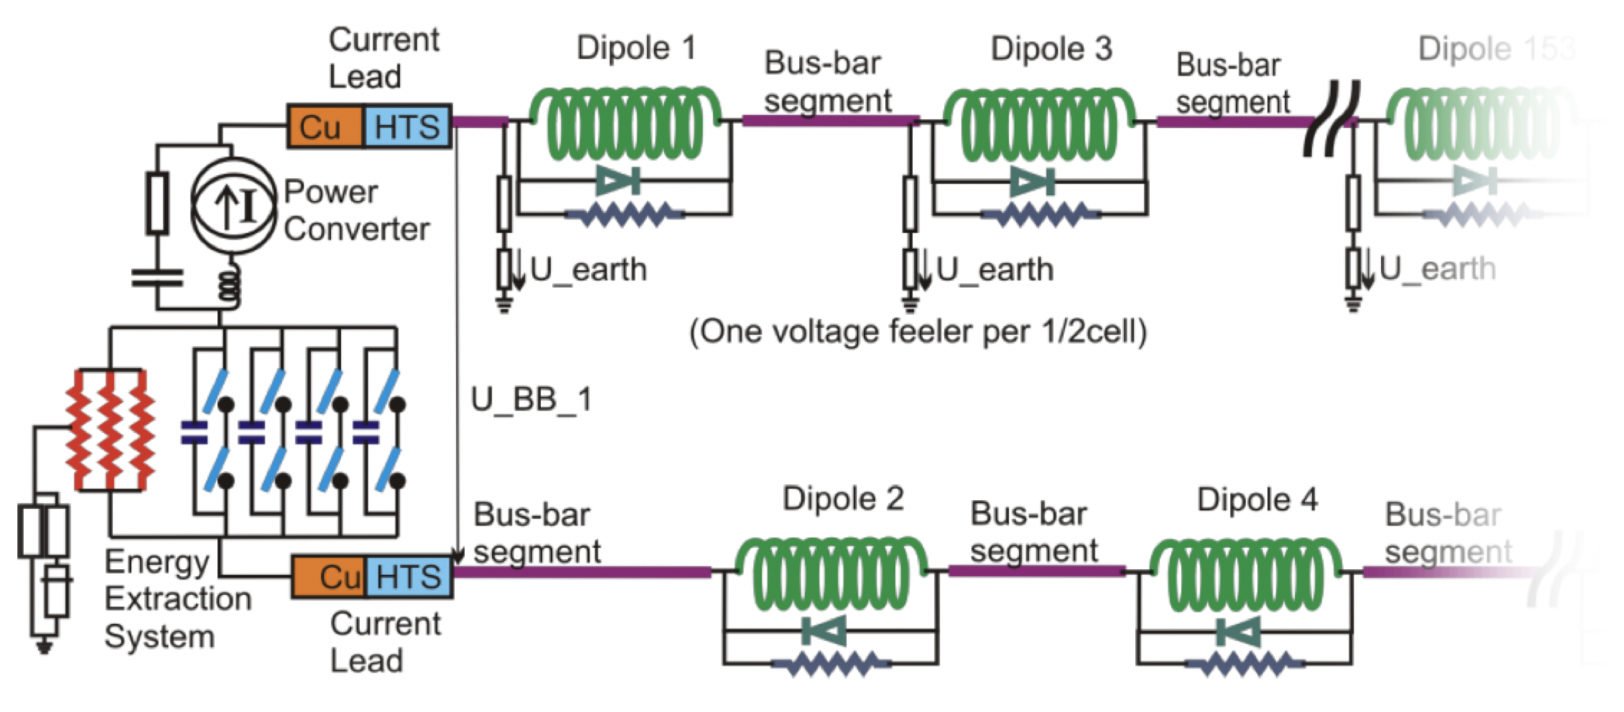
SCOPE
The initial scope of the project is to develop signal monitoring applications for:
- superconducting magnets and busbars;
- circuit and magnet protection systems;
- grounding networks;
- current leads
- ...
The framework however is expandable to account for other systems of a superconducting circuit (e.g., power converters) as well as other types of hardware (e.g., cryogenics, beam instrumentation, vacuum, etc.).
ECOSYSTEM
The Signal Monitoring project builds on top of the existing cluster computing infrastructure. We develop an API for interaction with Post Mortem and NXCALS databases. The API fuels HWC and Operation notebooks as well as signal monitoring notebooks and applications.
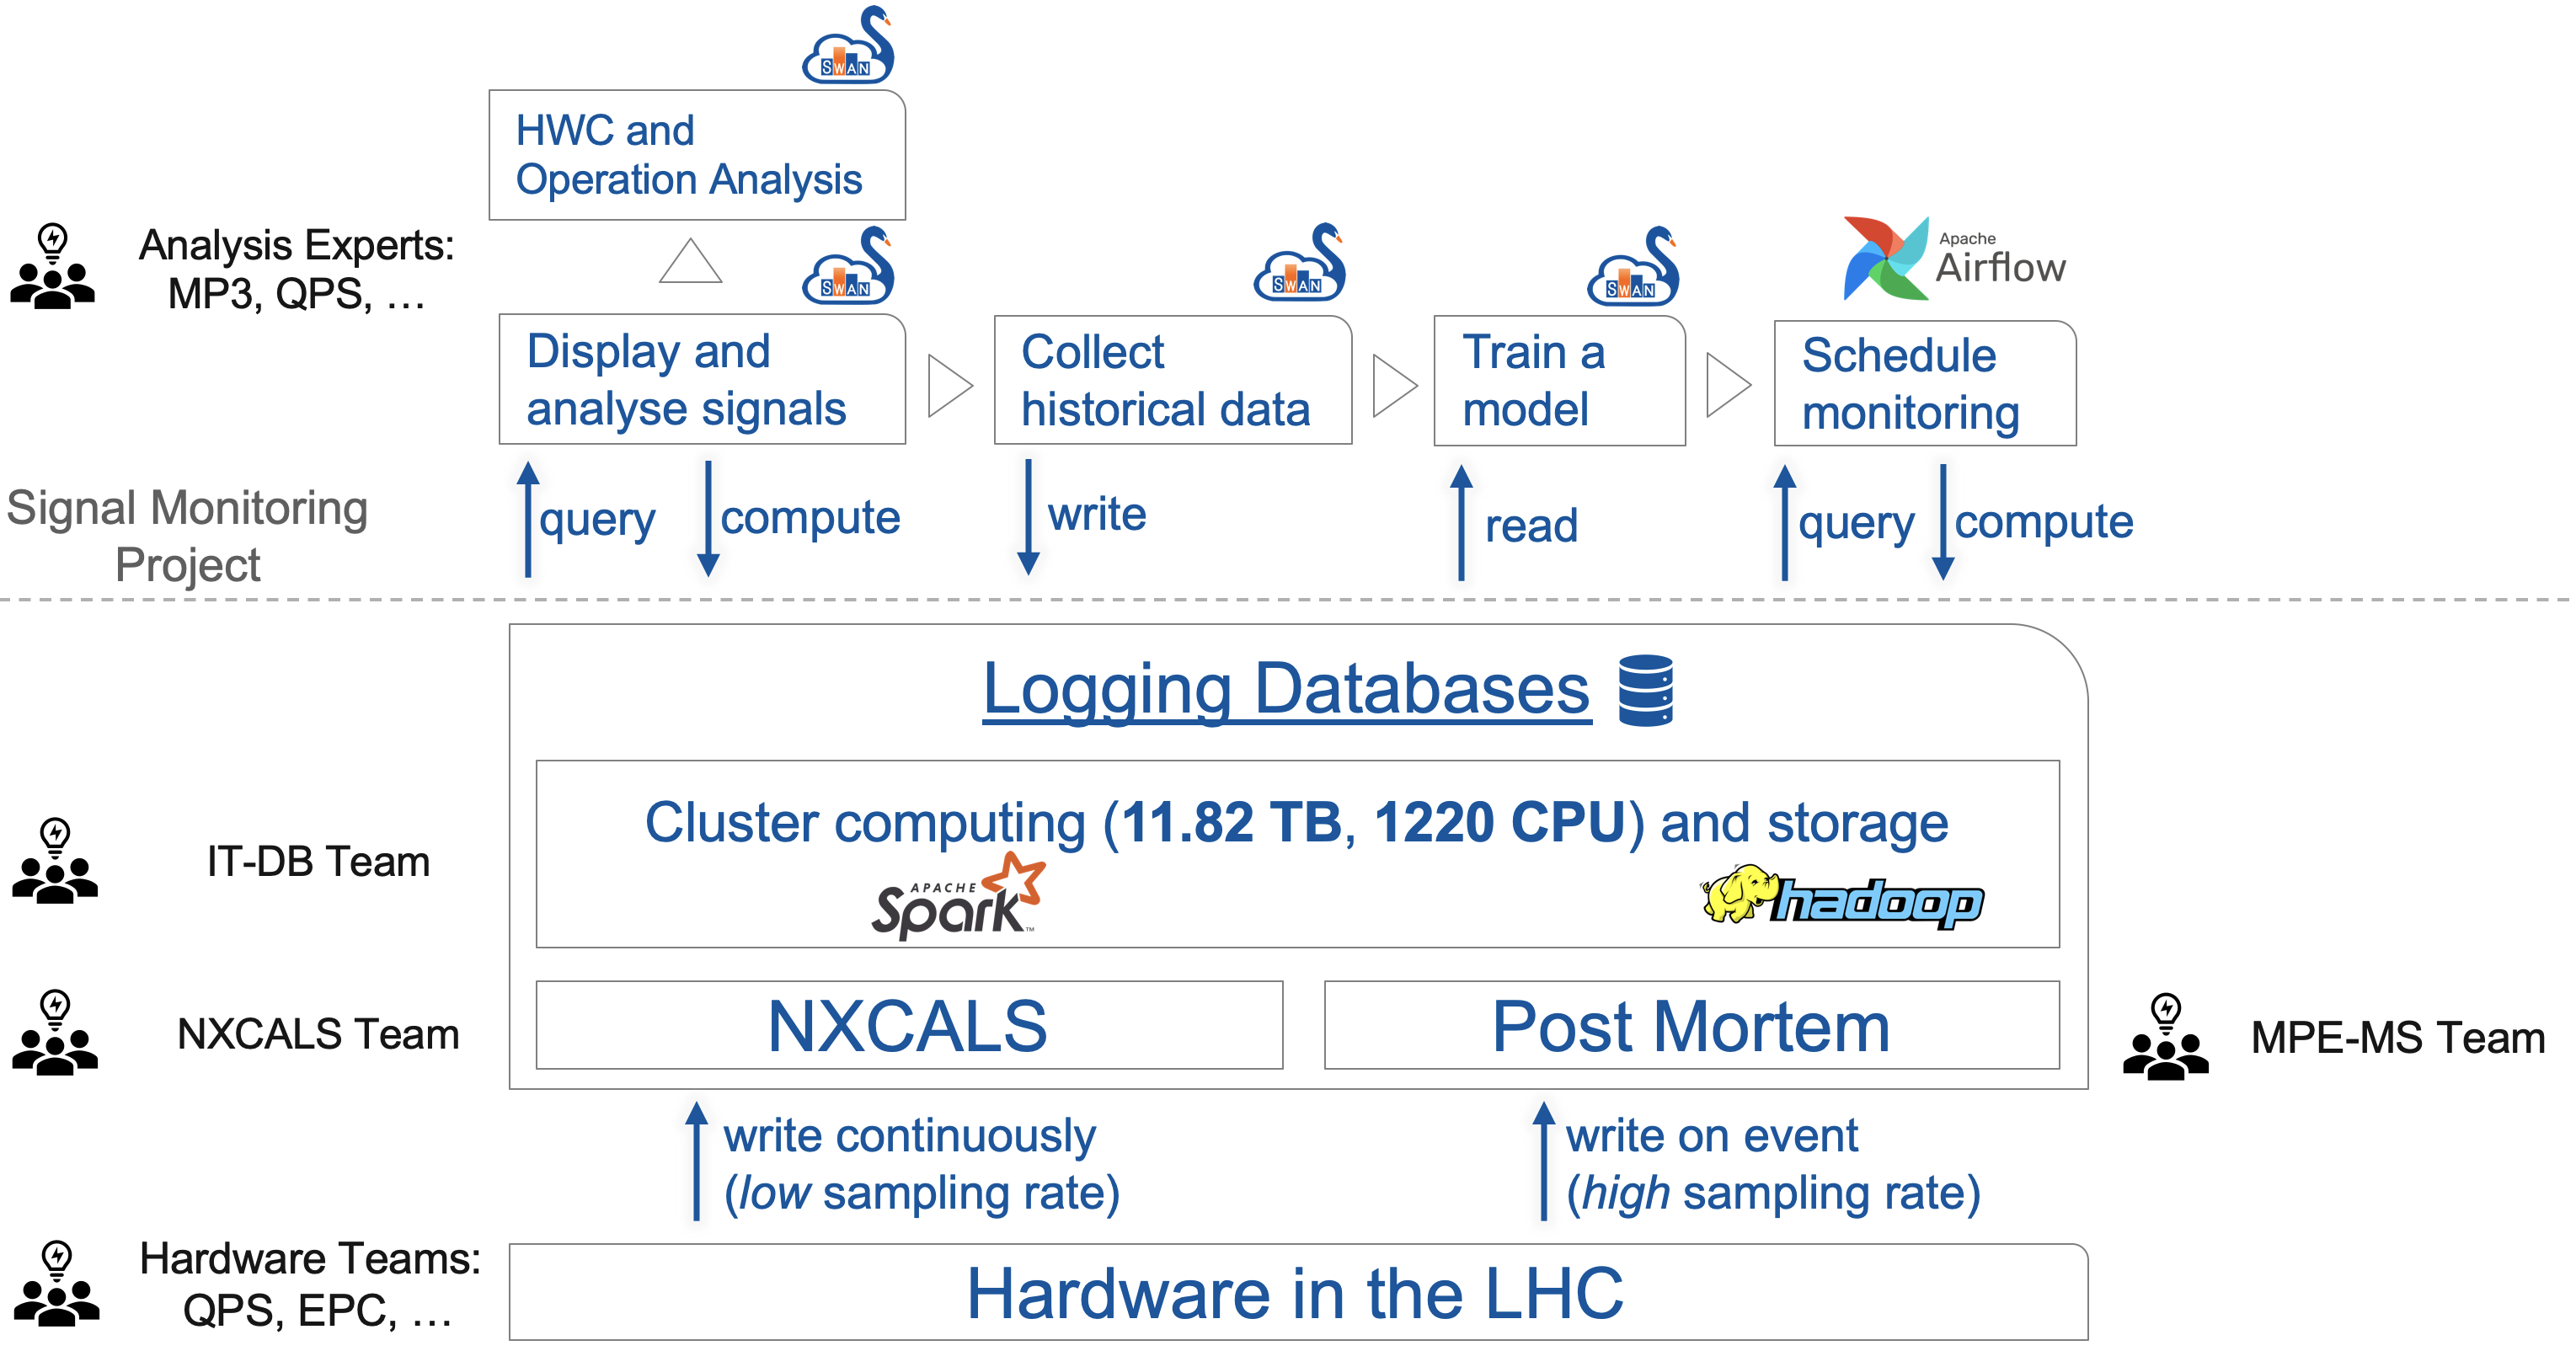
We aim at a coherent approach over all circuits, all systems, and all type of analyses
We use python due to the wealth of libraries for data analysis and modelling.
We rely on SWAN notebooks for development and communication across teams
ARCHITECTURE
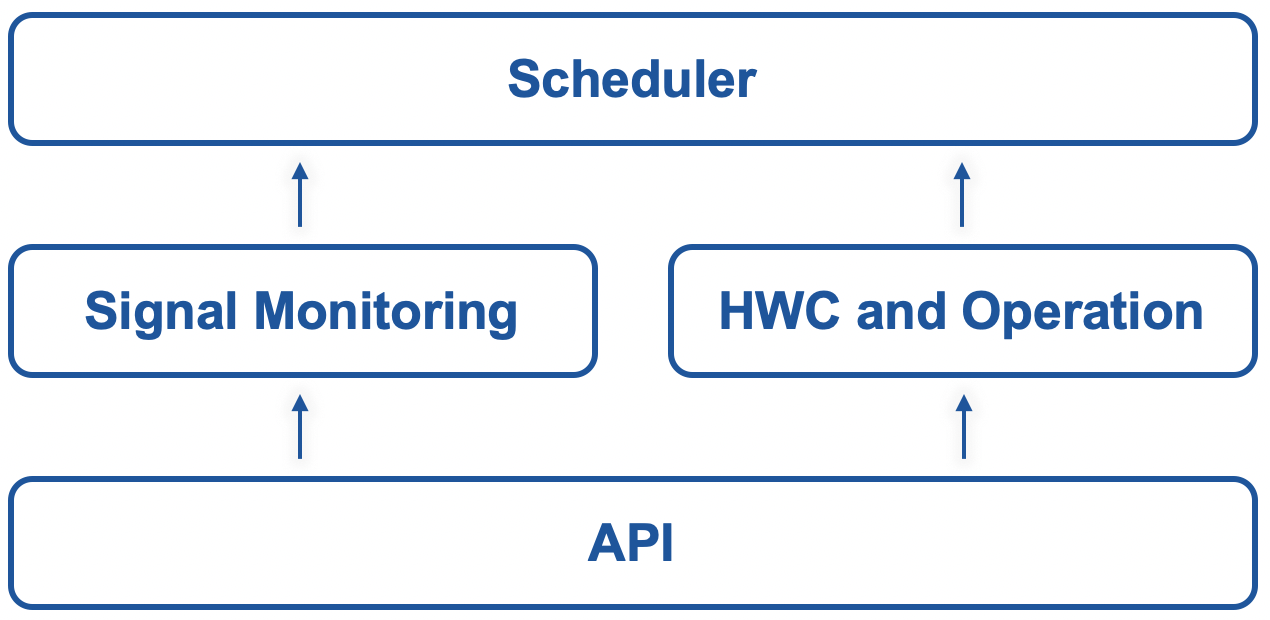
The project architecture consists of four elements:
- API for logging db query and signal processing
- Signal Monitoring notebooks
- HWC and Operation notebooks
- Scheduler for execution of HWC notebooks and monitoring applications
INFRASTRUCTURE
We leverage computing infrastructure provided by CERN IT department (prototyping with SWAN notebooks, distributing computing and storage with Apache Spark and Hadoop, respectively) orchestrated by a custom instance of Apache Airflow. The infrastructure is seamlessly integrated with the existing Post Mortem framework and natively supports NXCALS ecosystem.
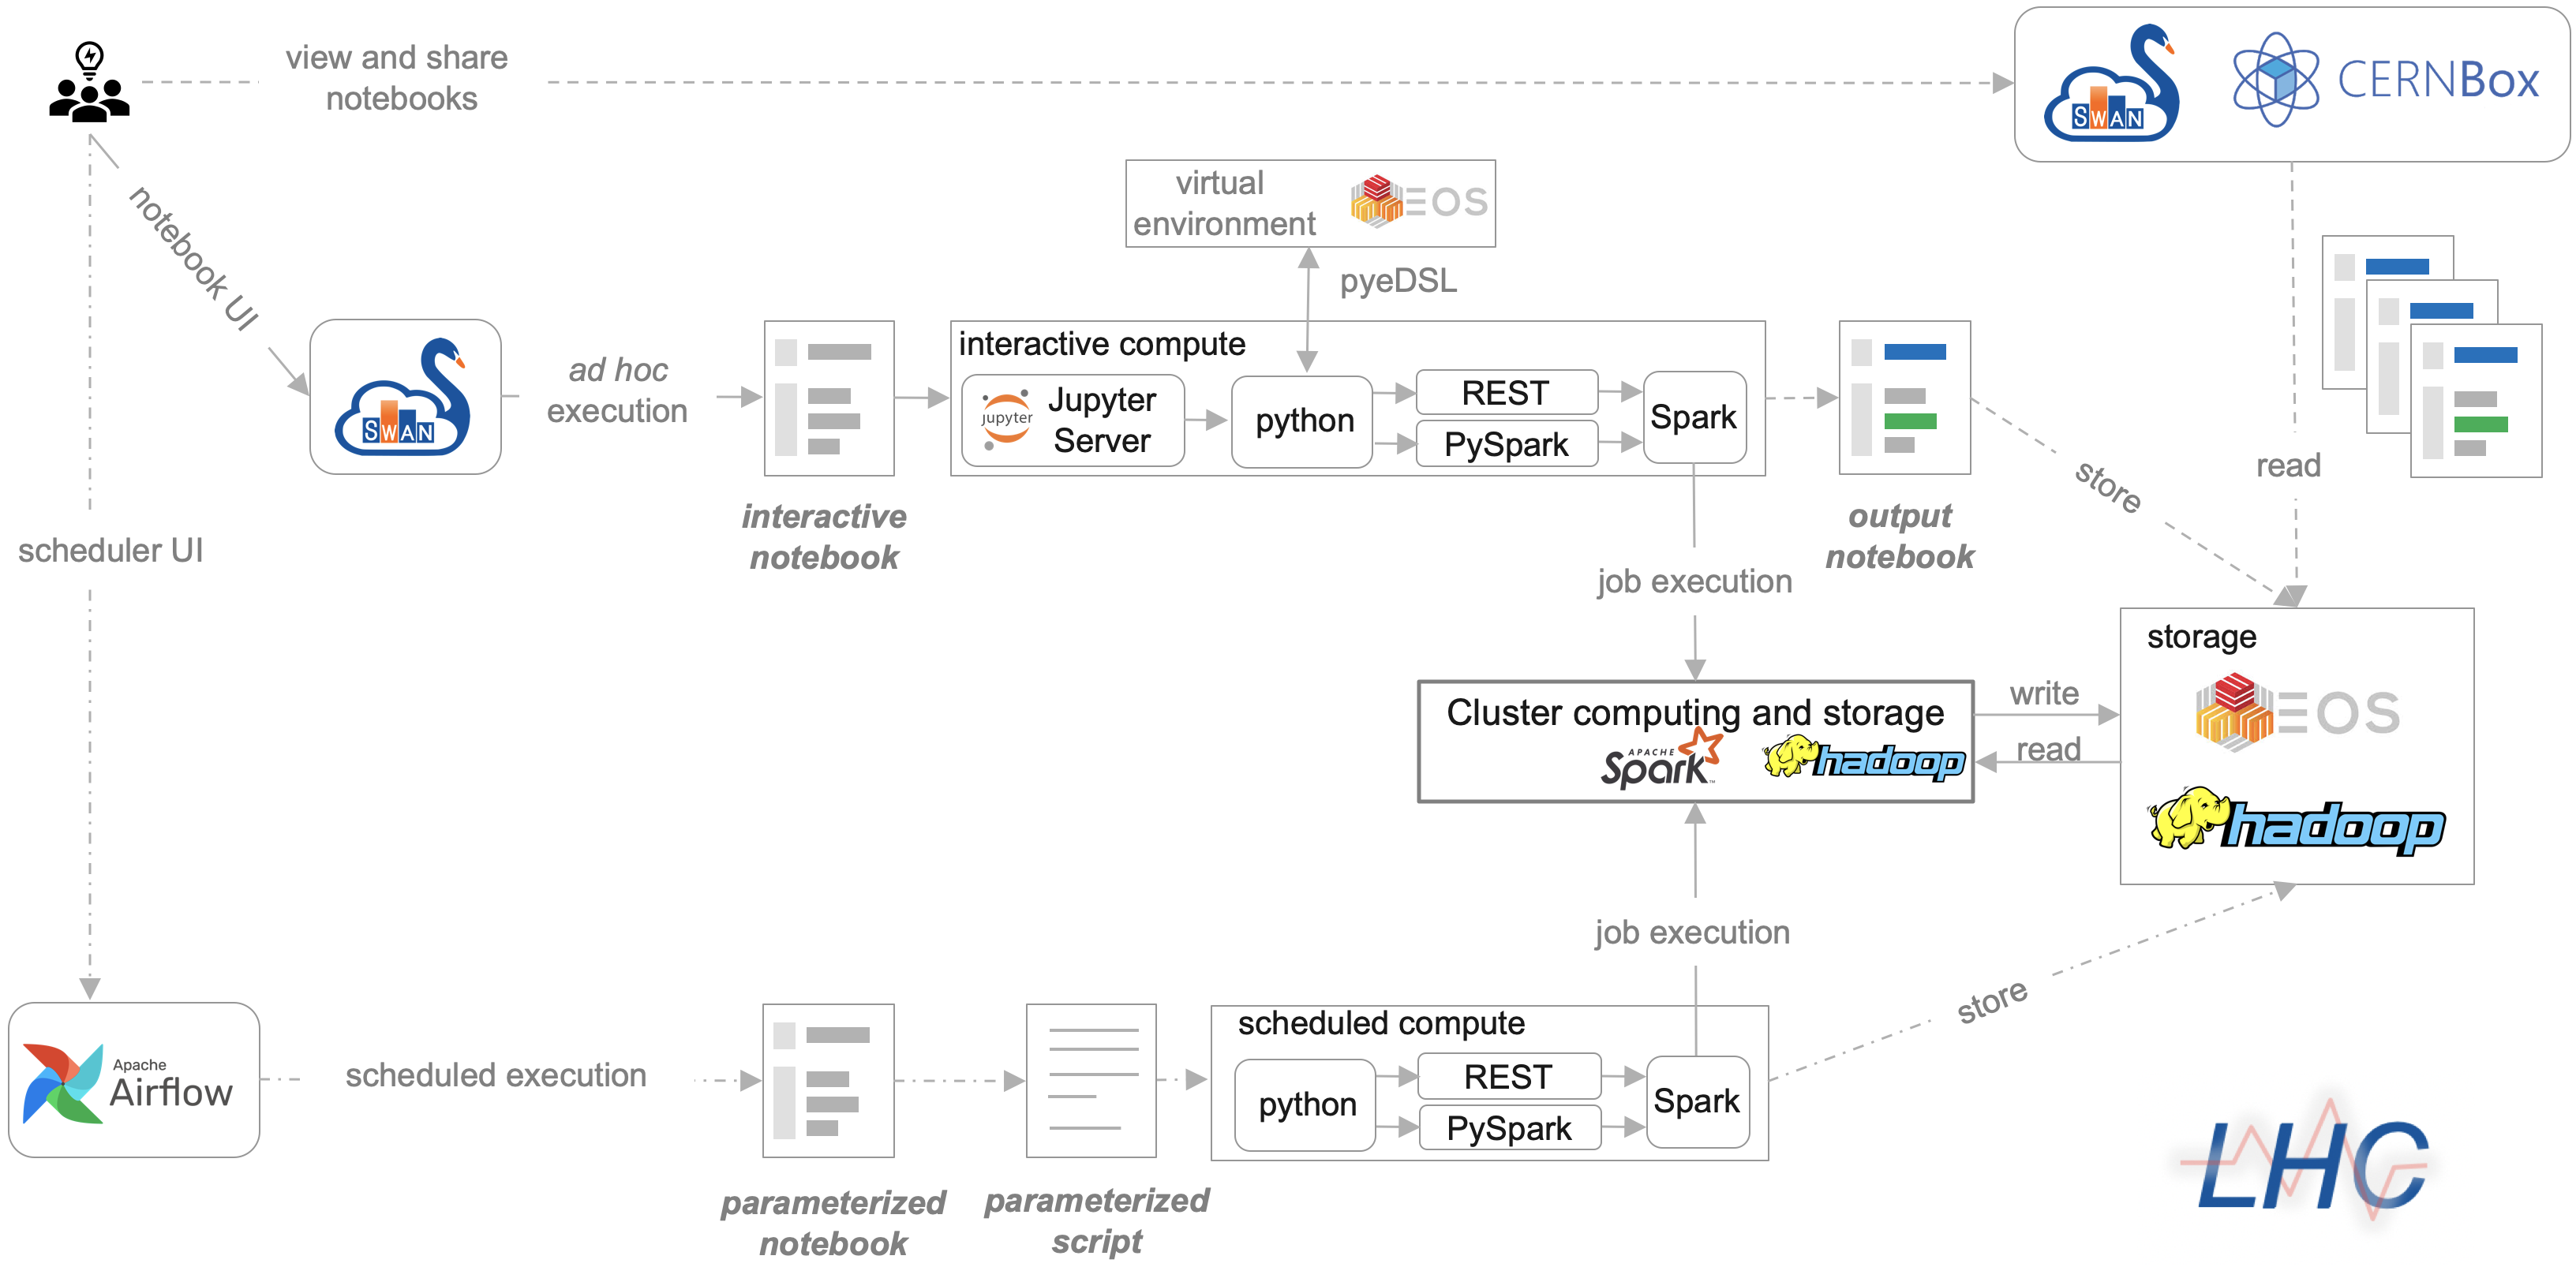
At each stage of the code execution pipeline, typically, a single line of code is needed to perform an operation (schedule analysis execution, perform computation on the cluster, save results to the persistent storage). All operations at each stage are performed in python.
Following this philosophy we developed own embedded domain specific language in python (pyeDSL).
Python Embedded Domain Specific Language

The pyeDSL unifies database queries while maintaining immanent differences of each database:
- PM: event, context, signal
- (NX)CALS: signal, feature
- AFT: context, fault
The QueryBuilder class provides a generic way for performing all query types. This brings the following benefits
- each input parameter defined once (validation of input at each stage)
- single local variable
- order of operation is fixed
- support for vector inputs
- time-dependent metadata
The pyeDSL documentation provides detailed description and additional classes for signal processing and feature engineering.

Signal Monitoring Workflow
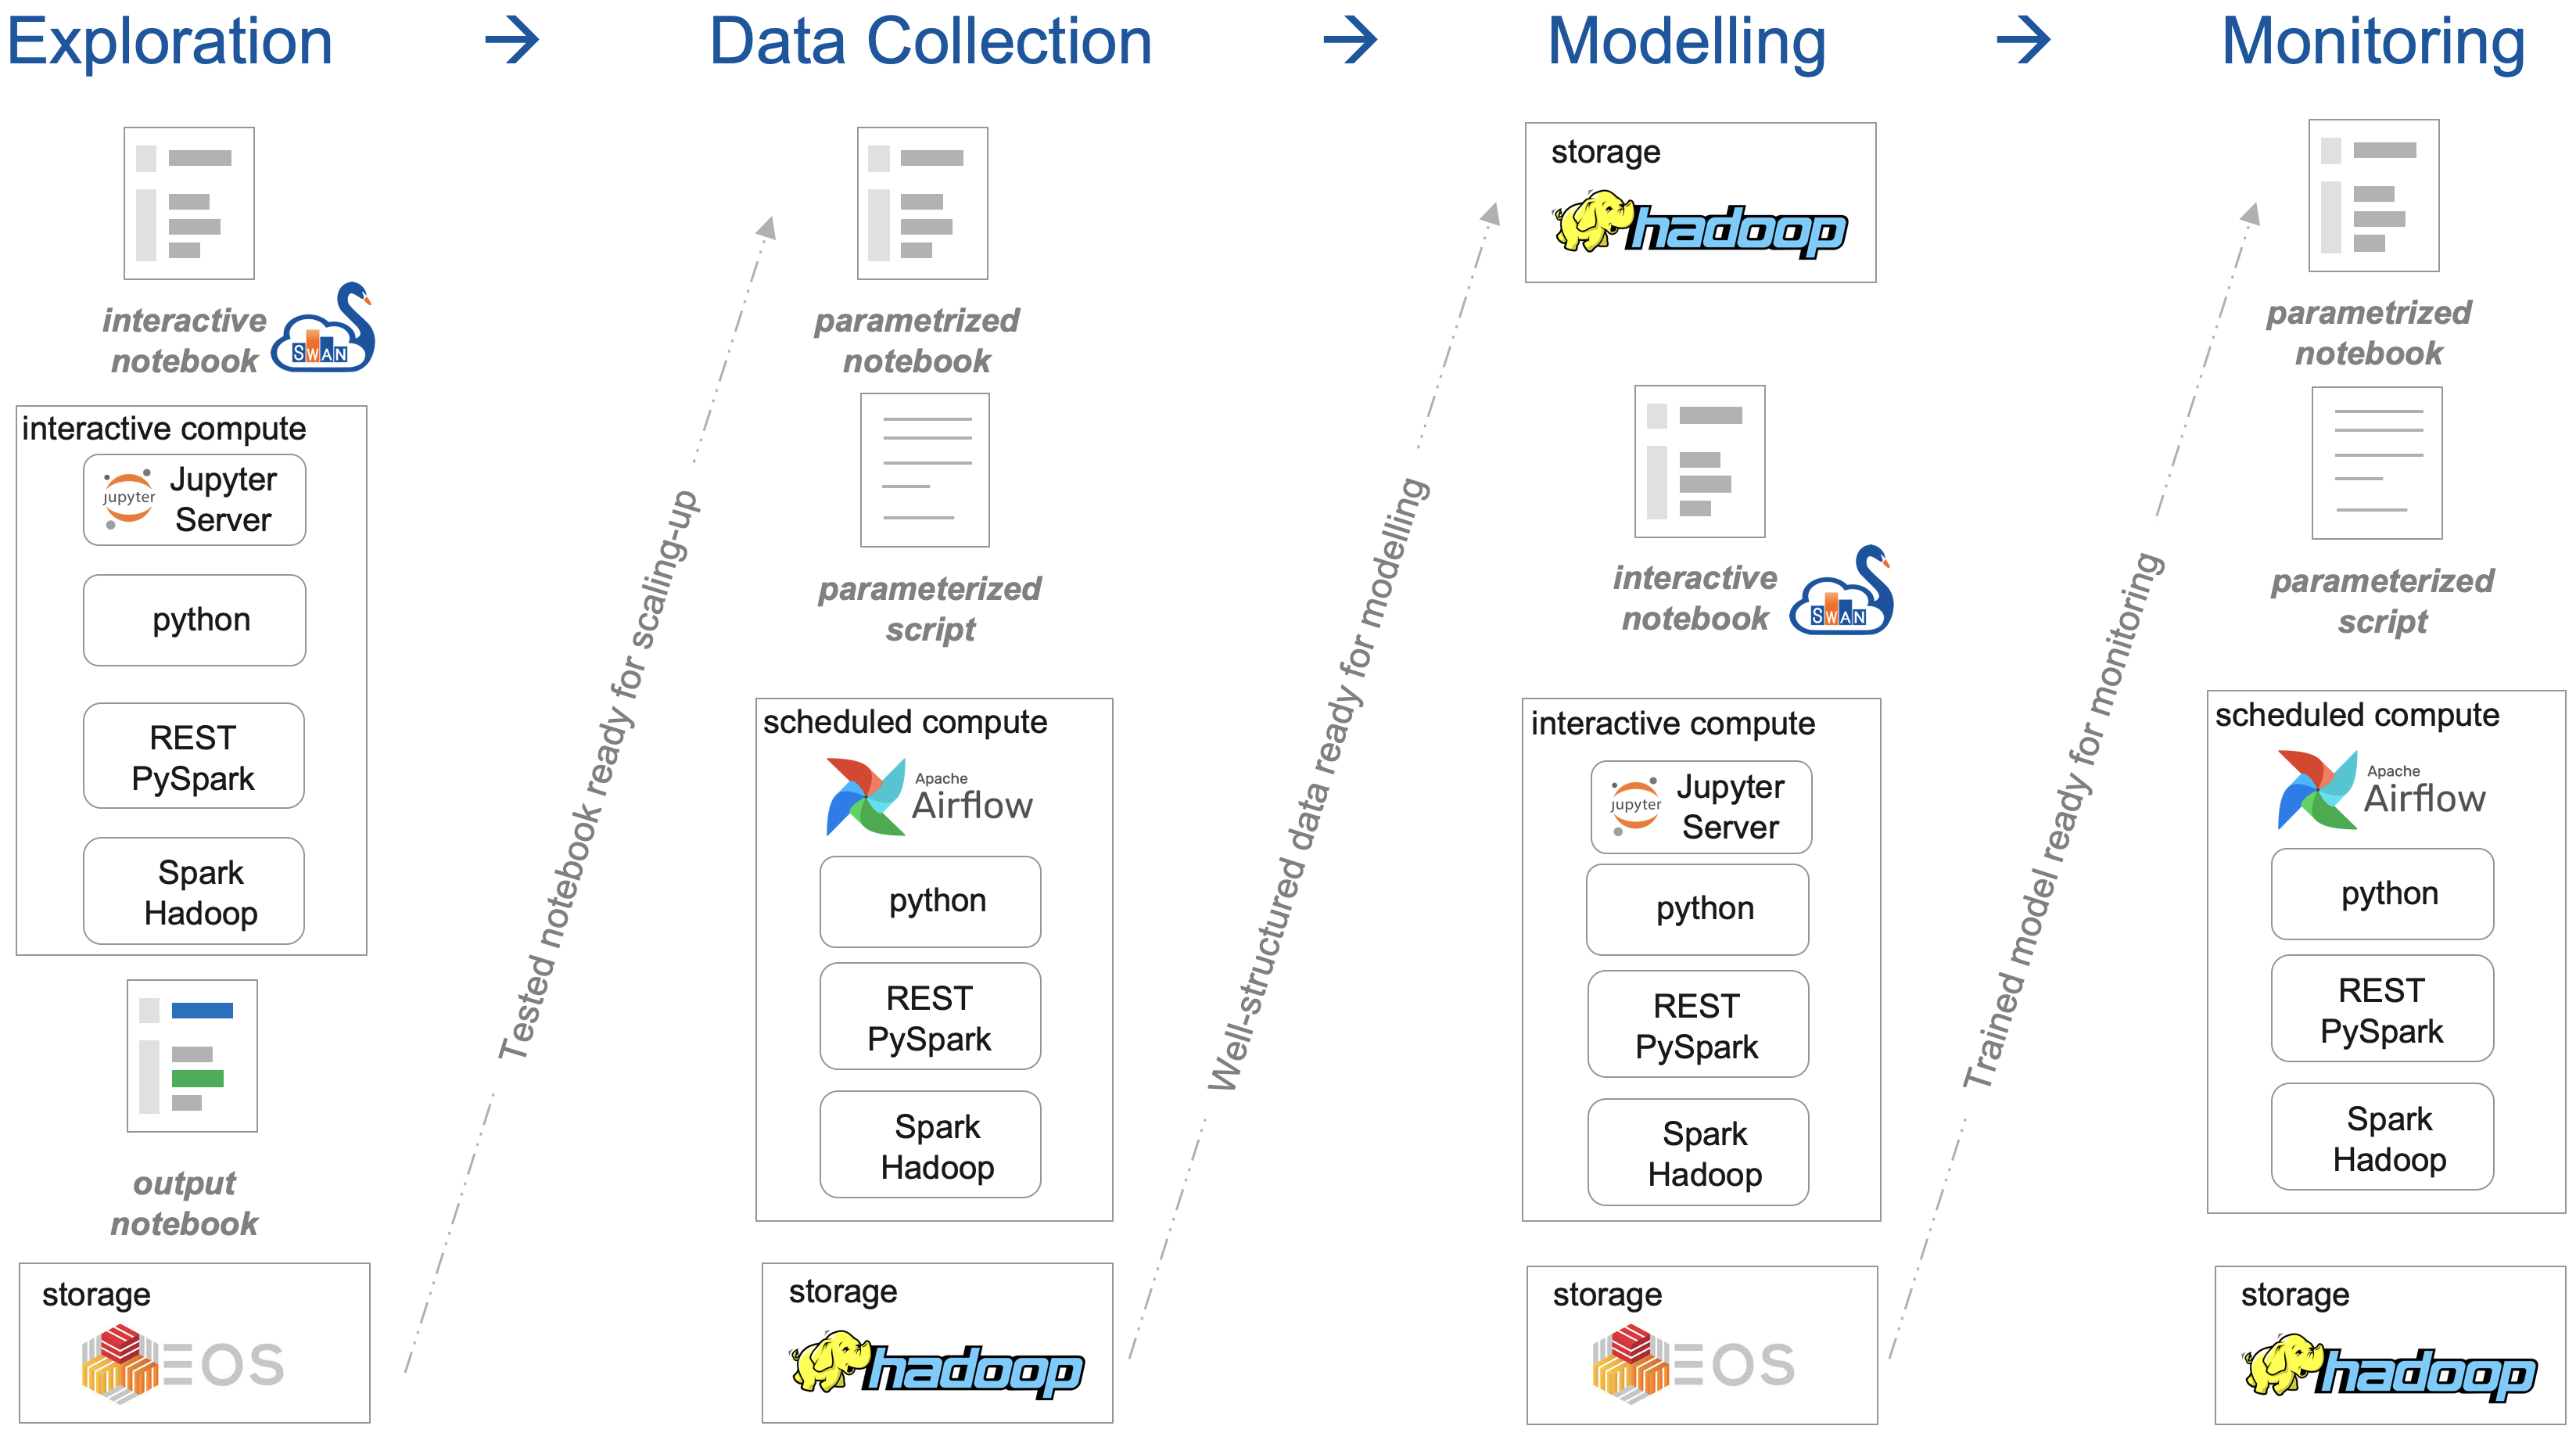
Exploration - getting the signal features right
Creation of a notebook to explore a signal and compute characteristic features.
| Feature 1 | Feature 2 | Feature ... | Feature n | |
| timestamp 1 | 0.078 | 980 | ... | 10.4 |
Data Collection - getting the right signal features
Execution of a notebook over past operation to collect data for numerical models
| Feature 1 | Feature 2 | Feature ... | Feature n | |
| timestamp 1 | 0.078 | 980 | ... | 10.4 |
| timestamp 2 | 0.081 | 995 | ... | 9.8 |
| timestamp ... | ... | ... | ... | ... |
| timestamp m | 0.08 | 1000 | ... | 10.1 |
Modelling
Once the historical data is gathered, a system modelling is carried out. There is a large variety of modelling methods available to encode the historical data in a compact form, which then can be used for signal monitoring. One grouping of methods divides models into: (i) physical; (ii) and data-driven. The physical models rely on equations describing the physics in order to represent historical data. The data-driven models use historical data and general-purpose equations to encode the system behaviour.

For the data-driven models, the left-to-right order can be interpreted in several ways:
- from a clear yes/no answer to vague probabilistic distributions;
- from zero predictive power to a certain predictive potential;
- from fully deterministic algorithms and clear answer, to deterministic algorithms and probabilistic answer, to non-deterministic algorithms and probabilistic answer;
- from low, to moderate, to high computational cost in order to develop and train the model;
- from full trust to result, to high-degree of trust, to low-level of trust;
Monitoring
Automatic execution of monitoring application depends on the operation state:
- triggered by Post Mortem events, e.g., Fast Power Abort, quench heater discharge
- triggered by change in the LHC beam mode
- in regular intervals, e.g., every hour

The monitoring applications perform the following types of comparisons in order to detect anomalies:
- With historical data we develop digital-twin models and derive trends
- With on-line data we compare behaviour with redundant copies of a system (intra-component) and across circuits of similar topology (cross-population)

NOTEBOOKS FOR HWC AND OPERATION
- Single notebook with a step-by-step analysis with detailed description
- Open notebook environment to adjust analysis according to test needs
- Automatic generation of MP3-compatible result tables and single-file HTML reports for sharing and storage
- Interactive Schematic of the RB Circuit for Hardware Commisioning and Operation Analysis
SUPPORTED CIRCUITS
The main dipole circuit composed of 154 superconducting magnets.
The main quadrupole circuit consisting of 47/51 superconducting magnets.
INTEGRATION WITH OTHER PROJECTS AT TE-MPE-PE
The integration of the Signal Monitoring project with other projects run at the PE section is at the stage of several successful proof-of-concept joint use cases. In fact, the PE section carries out numerous analysis of the machine protection equipment. A sheer number of analyses relies of signals logged in PM and (NX)CALS databases. Although each analysis is custom and requires a deep understanding of the underlying physics, at the very least, a database query and analysis execution on the computing infrastructure shall be reused. In this context, the pyeDSL language provides a general-purpose way of querying logging databases as well as some frequent signal processing methods. Furthermore, the signal monitoring pipeline can be used for execution of computation on the Spark cluster as well as triggering of monitoring applications with Apache Airflow. An important aspect is definition of a common persistent storage strategy such that the created datasets can be readily available to perform different types of analyses (instead of performing a time-consuming query of signals).
Simulation of Transient Effects in Accelerator Magnets
use of pyeDSL for signal query in order to validate models
use of validated network models for monitoring
Reliability and Availability
use of pyeDSL for signal query to gather failure rates
use of experience in machine learning algorithms for monitoring
Beam Impact and Machine Protection Studies
use of pyeDSL for signal query to gather beam-related data
use of BLM knowledge to identify beam-induced quenches for monitoring
DEVELOPMENT ENVIRONMENT
- PyCharm IDE (Integrated Development Environment) - it is a desktop application for Python development. PyCharm comes with a number of features facilitating code development (code completion, code quality checks, execution of unit tests, code formating, etc.)
- GitLab CI/CD - we use GitLab repository for code versioning and execution of the continuous integration pipeline for the API:
- execution of all unit tests with GitLab CI
- static code analysis with sonarQube
- analysis of input arguments and return types with mypy package
- creation of the API documentation based on code doc strings. The documentation is created with Sphinx package and stored on EOS.
- provided that all unit tests were passed, creation of lhcsmapi package with python package index (PyPI)
- SWAN is a platform for development and prototyping of analysis and signal monitoring notebooks
- NXCALS cluster is used for code execution with Apache Spark
- Apache Airflow schedules execution of signal monitoring applications
- EOS, influxdb, and HDFS are used as persistent storage for computation results.
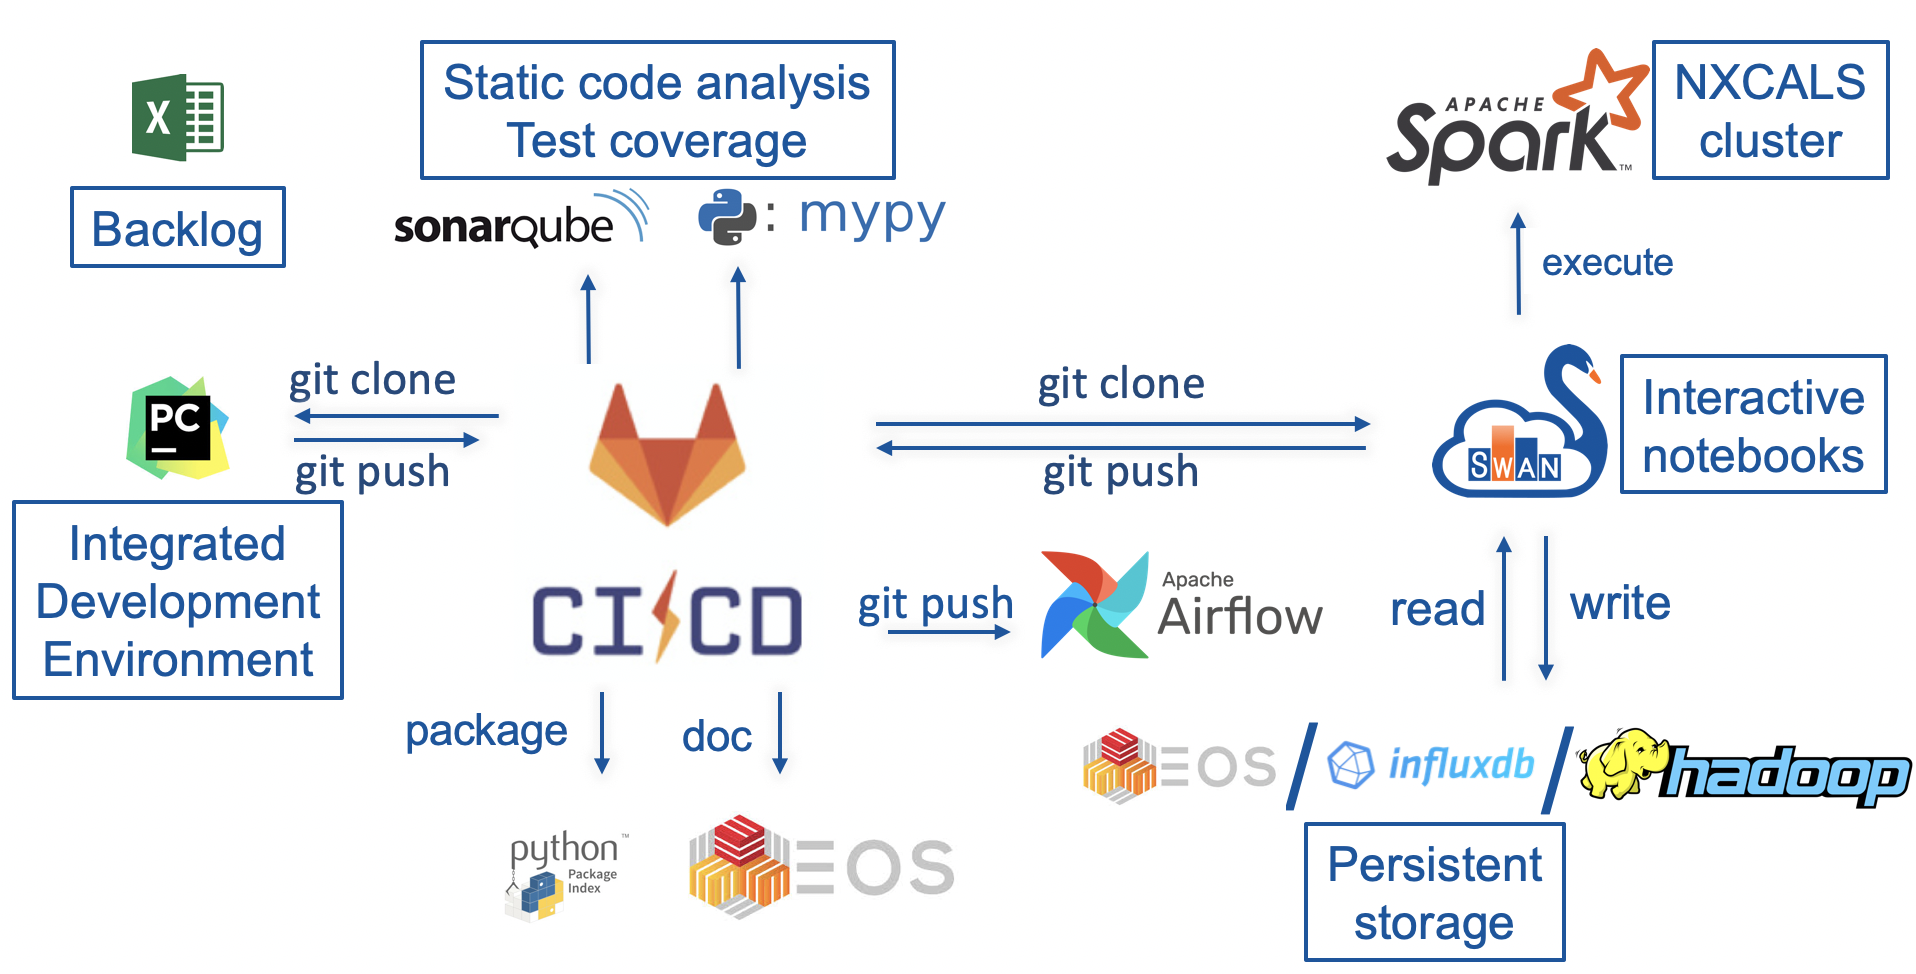
We rely on industry-standard tools for the automation of the software development process. Majority (except for PyCharm IDE and Python Package Index) services are supported by CERN IT department reducing the maintenance effort.